🚨 Introduction
Picture this scenario.
It's 2:00 AM. A fiber node in your network goes down. Forty clients lose their connection. By 6:00 AM, your phone has 23 missed calls, your Facebook page has angry comments, and three clients have already messaged asking to cancel.
Now picture a different scenario.
It's 2:00 AM. A fiber node in your network goes down. Your monitoring system detects it in 30 seconds, creates a support ticket automatically, and sends an SMS to your on-call technician. By 2:45 AM, the issue is resolved. By morning, clients received an automated message: "We detected and resolved a brief connectivity issue in your area last night. Your service is fully restored."
Same problem. Completely different outcome.
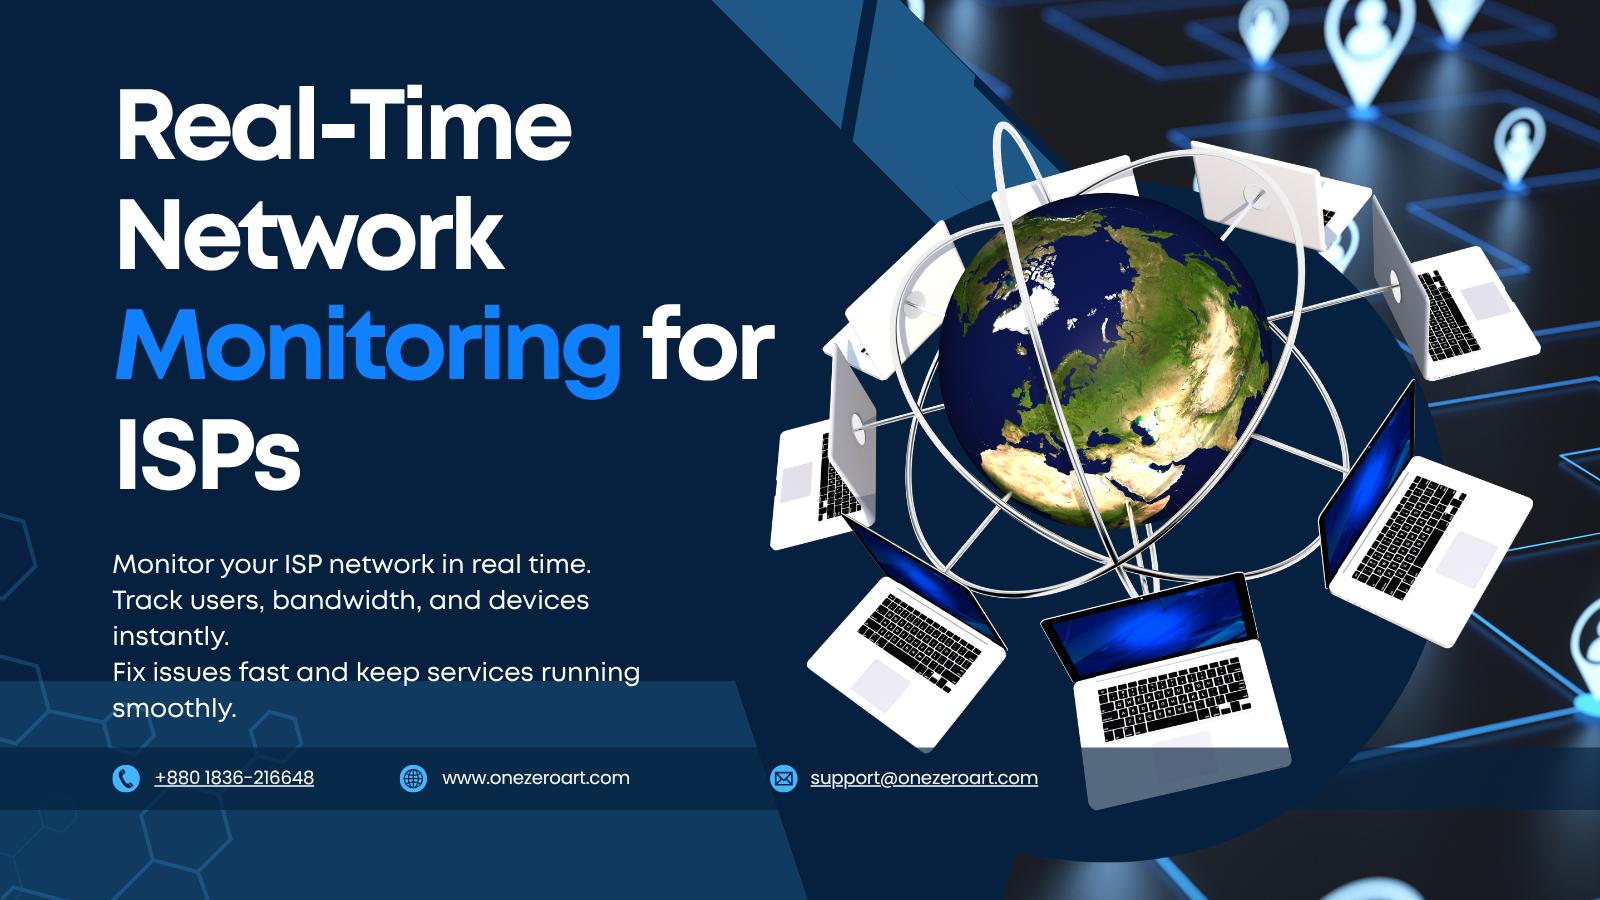
The difference between these two scenarios is one thing: real-time network monitoring.
After working with 200+ ISPs across South Asia, we can say with certainty — the ISPs that monitor proactively retain more clients, resolve issues faster, and build a reputation that drives referrals. The ones that wait for complaints are always putting out fires.
This guide covers everything you need to build a professional real-time monitoring setup for your ISP in 2026 — from what to monitor, to the tools that make it possible, to how Zal Ultra ISP CRM and ABC Syslog Server give you complete network visibility from a single dashboard.
📊 Why Real-Time Monitoring Is Now a Business Requirement
In 2026, clients are less tolerant of downtime than ever before. Here's what the data shows:
- 91% of ISP client complaints are about slow speed or disconnection — problems detectable by monitoring before the client notices
- ISPs with proactive monitoring resolve issues 3.8x faster than those relying on client-reported complaints
- Every 1 hour of undetected downtime costs a 500-client ISP an average of $180–$320 in credits, churn, and support overhead
- ISPs that send proactive status updates during incidents have 62% lower churn compared to those who go silent
The math is simple: the cost of monitoring tools is a fraction of the cost of undetected downtime.
🔍 What Real-Time Monitoring Actually Means for an ISP
"Monitoring" is a broad word. For an ISP, real-time monitoring covers five distinct layers — and you need visibility into all five to truly protect your business.
Layer 1: Device Status Monitoring
Are your routers, switches, OLTs, and access points online right now?
This is the foundation. Every active device in your network should be pinged at regular intervals — typically every 30–60 seconds. The moment a device stops responding, your system should:
✅ Log the event with exact timestamp ✅ Create a support ticket automatically ✅ Alert the responsible technician via SMS or app notification ✅ Show the affected device on your network map in red
Without this, a dead router sits undetected until a client calls.
Layer 2: Subscriber Session Monitoring
Are your clients actually connected and authenticated right now?
Your RADIUS server knows the answer to this question in real time. But without CRM integration, that data sits in log files no one is reading.
Real-time subscriber monitoring means:
✅ Seeing every active PPPoE/Hotspot session on your dashboard ✅ Instantly knowing how many clients are online vs. offline vs. suspended ✅ Detecting when a client's session drops and reconnects repeatedly — a sign of a local equipment issue before they even notice ✅ Identifying clients with zero usage for 48+ hours — often a sign of a problem or a risk of churn
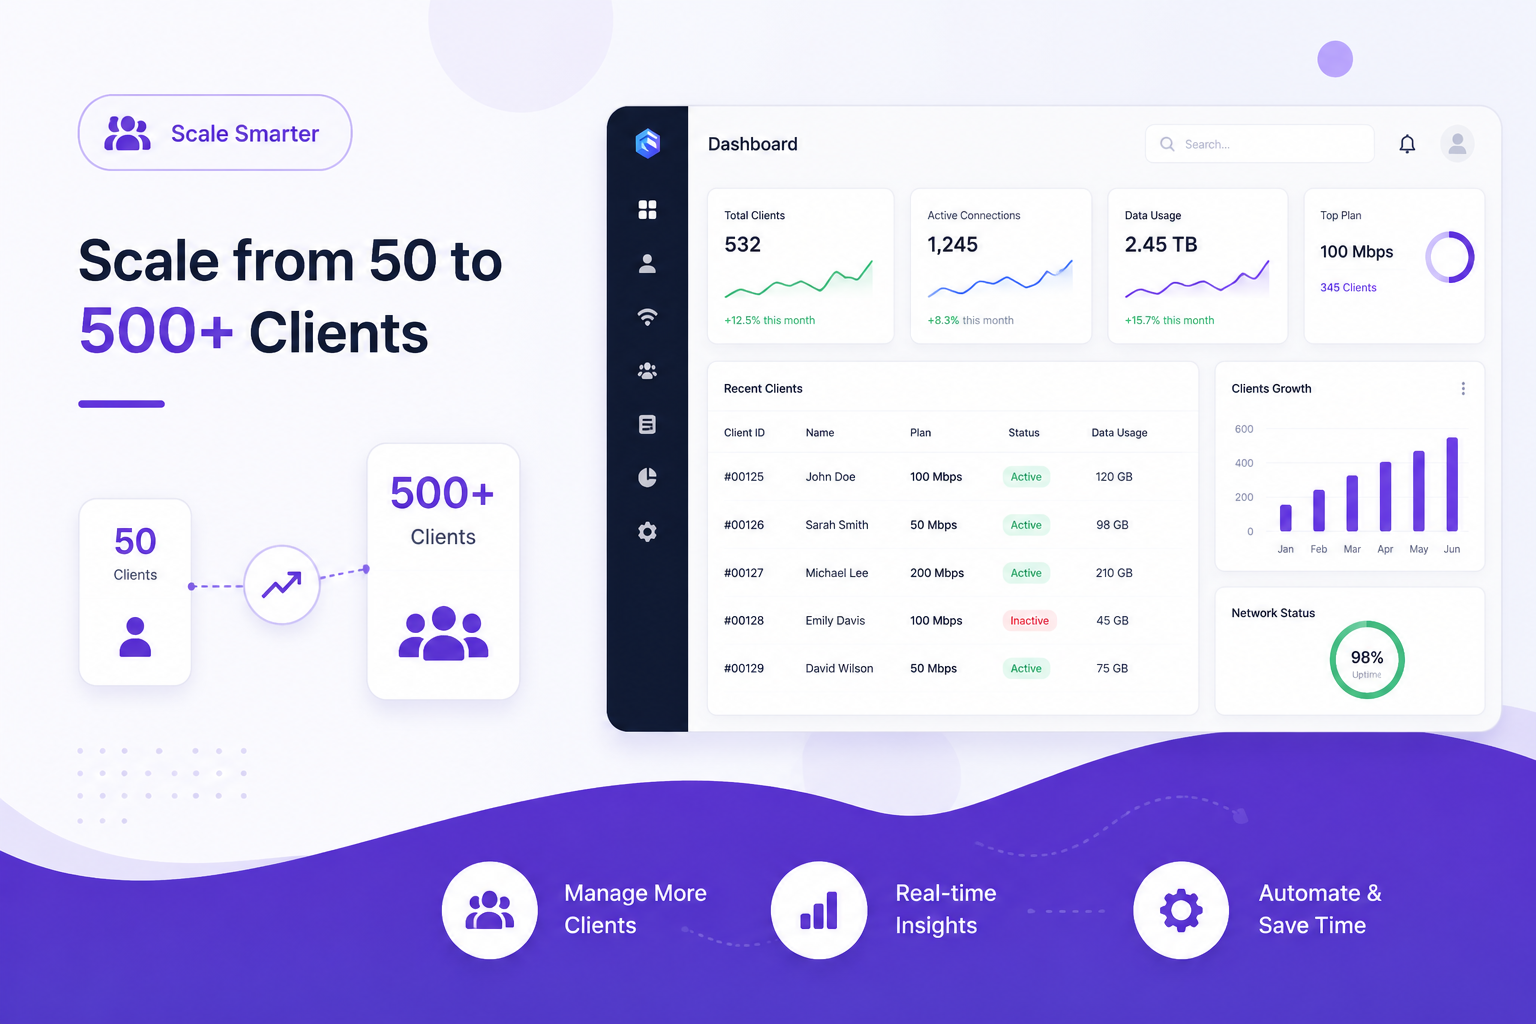
Zal Ultra ISP CRM pulls live session data directly from RADIUS and displays it in a clean, searchable dashboard — updated in real time, not end-of-day batch reports.
Layer 3: Bandwidth and Traffic Monitoring
Is your network running at healthy utilization levels right now?
Bandwidth monitoring tells you:
✅ Which links are approaching saturation (and when) ✅ Which clients are consuming disproportionate bandwidth (potential abuse or resale) ✅ Whether your upstream transit capacity needs to be upgraded ✅ Early signs of a DDoS — sudden traffic spikes from unusual sources
Without bandwidth visibility, ISPs often discover capacity problems after clients are already experiencing degraded speeds — too late to prevent the complaints.
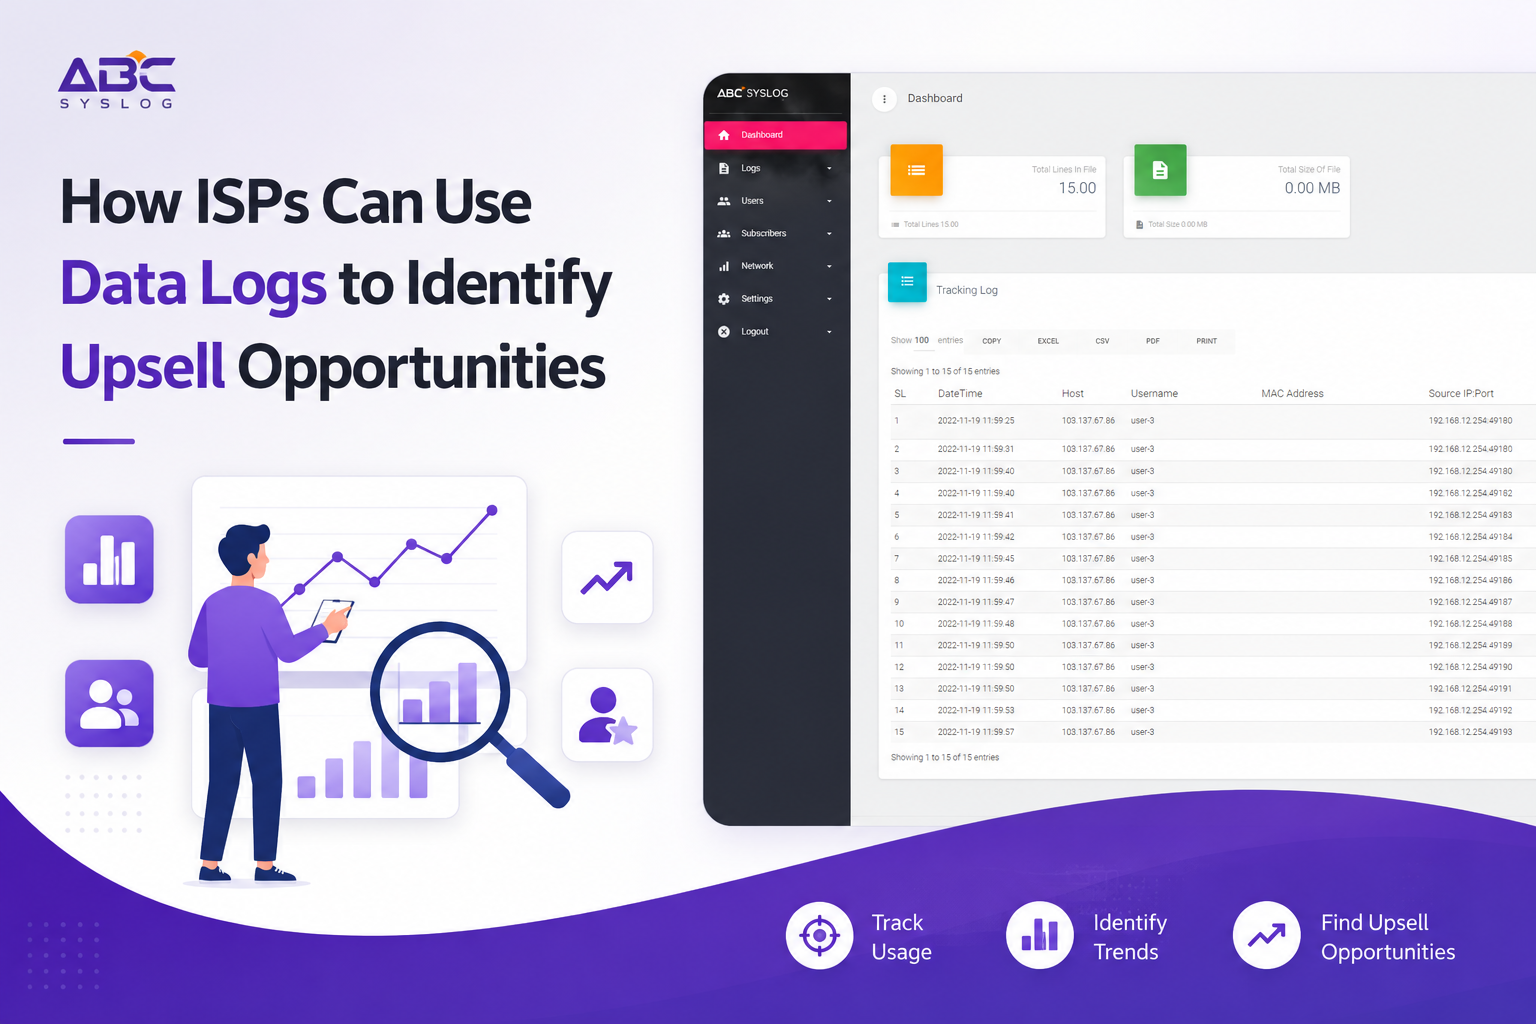
Layer 4: Syslog and Event Monitoring
What is happening inside your routers and servers right now?
Every MikroTik, Cisco, Ubiquiti, and Linux server on your network is constantly generating log events. These logs contain critical intelligence:
- Failed login attempts (brute force attacks in progress)
- Configuration changes (who changed what, and when)
- Interface errors and hardware warnings
- Authentication failures from clients
- DHCP pool exhaustion warnings
The problem is that these logs are generated on individual devices — scattered across your infrastructure. Without centralized collection, they're essentially invisible.
ABC Syslog Server by Onezeroart solves this completely. It collects syslog data from every device on your network into one searchable, real-time dashboard — with automatic alerts for critical events.
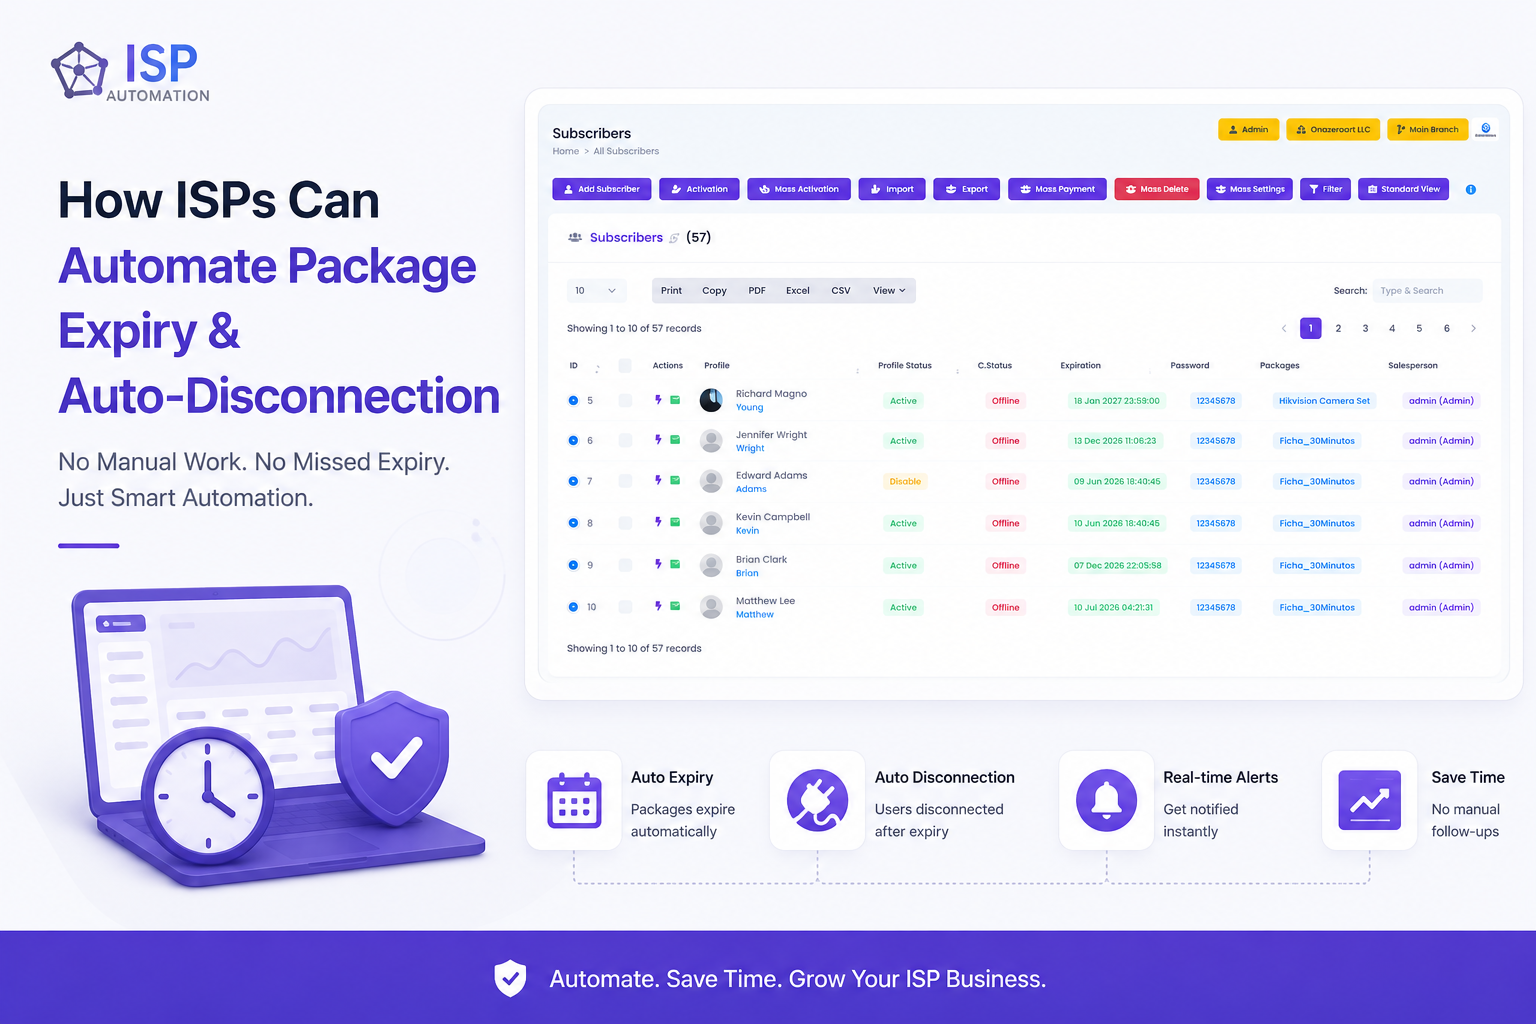
Layer 5: Billing and Service Expiry Monitoring
Are any clients about to expire or go into arrears right now?
Monitoring isn't just about network hardware. It also means watching your service delivery:
✅ Clients expiring in the next 24/48/72 hours — send reminders automatically ✅ Clients with overdue payments — trigger automatic suspension workflows ✅ Clients on packages that no longer match their usage — flag for upsell ✅ Package activation failures — catch provisioning errors before the client calls
🛠️ The Complete ISP Monitoring Stack for 2026
Here's exactly what a professional ISP monitoring setup looks like today:
| Tool | Purpose | What It Monitors |
|---|---|---|
| Zal Ultra ISP CRM | Core platform | Sessions, subscribers, billing, device status |
| ABC Syslog Server | Log aggregation | Router/switch logs, auth failures, config changes |
| MikroTik SNMP | Device telemetry | Interface counters, CPU, memory, uptime |
| FreeRADIUS Accounting | Session tracking | Auth, accounting start/stop, interim updates |
| Grafana + InfluxDB | Traffic graphs | Bandwidth utilization per interface and client |
| Telegram / SMS Alerts | Notifications | Instant alert delivery to technicians |
You do not need all of these from day one. But every ISP should have at minimum: Zal Ultra CRM + ABC Syslog + RADIUS accounting working together. These three alone give you 80% of the visibility you need.
⚙️ Setting Up Real-Time Monitoring: Step-by-Step
✅ Step 1: Enable RADIUS Interim Updates on All NAS Devices
Without interim updates, RADIUS only knows when a session starts and stops. It has no visibility into what's happening in between.
On MikroTik:
/ppp profile set default interim-update=3m use-radius=yes
/radius set [ find ] accounting=yes
This sends a heartbeat every 3 minutes to RADIUS — keeping session data current and accurate in Zal Ultra's dashboard.
✅ Step 2: Enable SNMP on All Network Devices
SNMP lets your monitoring system pull live statistics from routers and switches — CPU load, memory usage, interface traffic, uptime.
On MikroTik:
/snmp set enabled=yes contact="[email protected]"
/snmp community set [ find ] name=public read-access=yes
Point your monitoring tool to the device's IP with community string public (or a stronger custom string for production).
✅ Step 3: Configure Syslog Forwarding to ABC Syslog Server
Every device on your network should forward its logs to a central syslog server.
On MikroTik:
/system logging action set remote bsd-syslog=yes \
  name=remote remote=YOUR_SYSLOG_SERVER_IP \
  remote-port=514 src-address=0.0.0.0 syslog-facility=daemon
/system logging add action=remote topics=critical,error,warning,info
In ABC Syslog Server, you'll immediately start seeing log streams from each device — searchable by device, severity, time range, and keyword.
✅ Step 4: Set Up Automated Alerts
Monitoring without alerts is just data collection. The value is in being notified instantly when something goes wrong.
In Zal Ultra ISP CRM, configure alerts for:
✅ Client session offline for more than 10 minutes ✅ Device ping failure (router/OLT not responding) ✅ Payment overdue threshold reached ✅ Bandwidth utilization above 85% on a link ✅ New login from unknown IP on admin panel
Deliver alerts via SMS, Telegram bot, or email — whichever your team checks first at 2 AM.
✅ Step 5: Build Your Monitoring Dashboard
All of this data should feed into a single, unified dashboard that any team member can open and immediately understand the health of the network.
A good ISP monitoring dashboard shows:
- Total clients — online / offline / suspended / expired
- Active sessions — with real-time count and trend
- Device status — all NAS devices with ping status
- Recent alerts — last 10 events with severity
- Bandwidth overview — current utilization on main uplinks
- Billing status — clients expiring today / overdue
Zal Ultra ISP CRM's admin dashboard displays all of this in one screen — no need to switch between 4 different tools to understand your network status.
📖 Case Study: How Monitoring Saved an ISP During a Critical Failure
A 700-client ISP we work with in northern Bangladesh experienced a fiber cut on their backbone link in Q2 2025 — at 11:45 PM on a Friday.
Before they had monitoring: A similar incident 18 months earlier went undetected for 4 hours. By the time staff knew about it, 200 clients had already reported the issue on social media. They lost 14 clients that month.
With Zal Ultra + ABC Syslog: The fiber cut was detected in 47 seconds. An automatic alert fired to the on-call technician via Telegram. ABC Syslog showed the exact interface that went down and the timestamp. The technician dispatched a crew immediately. Service was restored in 2 hours and 18 minutes. An automated SMS was sent to affected clients at 2:10 AM explaining the situation.
Result: Zero client complaints the next morning. Zero churn that month. Three clients actually messaged complimenting the fast resolution.
The only difference was visibility.
💡 Frequently Asked Questions
Q: Our ISP has only 200 clients. Is real-time monitoring really necessary at this size? Yes — and this is actually the best time to set it up. At 200 clients, the setup is simpler, the data volume is manageable, and you're building habits that will scale cleanly to 2,000 clients. ISPs that wait until they're "big enough" to monitor properly end up scrambling to retrofit systems under pressure.
Q: We already use Dude or PRTG for monitoring. Why do we need Zal Ultra? Dude and PRTG are great for device-level network monitoring, but they have no awareness of your subscribers, billing state, or RADIUS sessions. Zal Ultra bridges the gap — connecting network events to client accounts so you know exactly which clients are affected by any issue, instantly.
Q: How does ABC Syslog Server differ from just reading router logs manually? Manual log reading means logging into each device individually and searching through raw text files — practically impossible across 20+ devices in real time. ABC Syslog centralizes everything, adds search and filtering, and sends alerts for critical patterns — turning log data into actionable intelligence.
Q: Can we monitor MikroTik, Cisco, and Ubiquiti devices from the same dashboard? Yes. Both Zal Ultra and ABC Syslog Server support any device that sends standard SNMP or syslog data — which covers virtually all enterprise networking equipment including MikroTik, Cisco, Ubiquiti, Huawei, and ZTE OLTs.
Q: What happens if our monitoring server itself goes down? This is a real risk. Best practice: run your monitoring stack (Zal Ultra, ABC Syslog) on a VPS with a separate internet uplink — not on the same physical server as your RADIUS or billing database. This way, a local server failure doesn't blind your monitoring at the same time.
🏁 Conclusion
In 2026, your clients do not care about the technical complexity of your network. They care about one thing: their internet works, all the time.
Real-time monitoring is how you deliver on that expectation — not by being lucky, but by having the visibility to detect problems in seconds and resolve them before anyone notices.
The ISPs building this capability now are creating a competitive advantage that compounds every month. Fewer complaints. Lower churn. Faster resolution times. A reputation for reliability that sells itself.
Zal Ultra ISP CRM and ABC Syslog Server give you everything you need to monitor your network like an enterprise provider — regardless of whether you have 200 clients or 20,000.
👉 Request a Free Demo of Zal Ultra ISP CRM 👉 Learn About ABC Syslog Server 👉 Contact Our Support Team
Published by Onezeroart Team | Security & Monitoring Category © 2026 Onezeroart LLC. All rights reserved.